--
Pulusi ‘o e Fakamatala Fakata’u 2016 – Ma’u Mafai ki he Ngaahi Taulanga ‘o Tonga
Ports Authority Tonga - Publication of 2016 Annual Report
The Ports Authority Tonga (PAT) is pleased to publish the summary of its 2016 Annual Report, including its performance against the business plan and 2017 projections, in accordance with Section 22 (2) of the Public Enterprises Act 2002. PAT registered a strong performance, thus completed another highly successful year for the Authority that serves as the trade, logistics and Tonga’s gateway for global maritime trade.
Highlights

1. Volumes
The cargo throughput increased by 15% from 290,532 tonnes in 2015 to 333,847 tonnes in 2016. This trend is expected to continue considering the major construction projects that are in progress in the country.
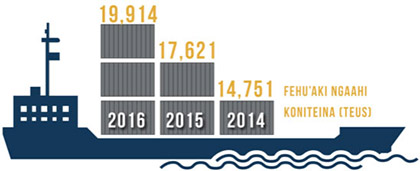
The Container throughput hit a record high of 19,914 in 2016.

2. Ships Called
The number of ships called at the Port of Nuku’alofa during the year increased considerably from 150 calls in 2015 to 179 at the end of 2016, a 19% increase or an average of 15 vessels per month.
3. Strategic Initiatives
PAT continued to invest in strengthening and maintaining the Authority’s operational efficiency. The capital investments were mainly for major port related projects including but not limited to:
- Installation of LED Lights at Queen Salote Wharf that are more power efficient with low voltages usage while providing much light.
- Upgrading the Vuna Wharf Yacht Marina.
- Paving Queen Salote International Wharf with Bitumen Cold Mix.
- Constructing the New Domestic Wharf.
- Acquisition of the new Kalmar Reachstacker.
- Upgrading of the Head Office Building Phase 1.

4. Community Involvement
PAT continued active involvement in promoting community activities at a total of $77,552.51 during the year.
5. Financials
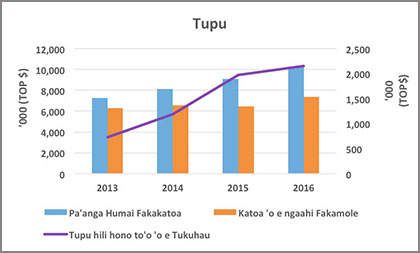
- The total Income recorded a new milestone in reaching $10 million at the end of the year, an increase of 13% from the previous year and 6% higher than the budget.
- The Net Profit After Tax recorded an unprecedented $2.2 million, an increase of 16% from the 2014/15 result.
- The Dividend declared and paid to the Shareholder increased by 62% to $1.6 million, representing 75% of the Net Profit After Tax.

6. Financial Performance
Statement of Financial Performance
|
Year ended 30 June |
2015 |
2016 |
2016 |
2017 |
|
Audited ($) |
Business Plan ($) |
Audited ($) |
Business Plan ($) |
|
|
Total Revenue |
9,071,100 |
9,708,000 |
10,252,211 |
11,078,000 |
|
Total Operating Expenses * |
(6,332,120) |
(7,341,000) |
(7,256,926) |
(7,521,000) |
|
Earning Before Interest and Tax (EBIT) |
2,738,980 |
2,367,000 |
2,995,285 |
3,557,000 |
|
Net finance cost |
(114,766) |
(177,000) |
(119,087) |
(177,000) |
|
Net Profit Before Tax |
2,624,214 |
2,190,000 |
2,876,198 |
3,380,000 |
|
Income Tax |
(653,197) |
(547,000) |
(719,049) |
(845,000) |
|
Net Profit After Tax |
1,971,017 |
1,643,000 |
2,157,149 |
2,535,000 |
|
Statement of Financial Position |
||||
|
As at 30 June |
2015 |
2016 |
2016 |
2017 |
|
Audited ($) |
Business Plan ($) |
Audited ($) |
Business Plan ($) |
|
|
Current Assets |
4,371,981 |
4,298,000 |
3,818,035 |
4,121,000 |
|
Non-Current Assets |
19,331,138 |
23,775,000 |
20,656,112 |
24,768,000 |
|
Total Assets |
23,703,119 |
28,073,000 |
24,474,147 |
28,889,000 |
|
Current Liabilities |
2,457,120 |
2,100,000 |
2,723,110 |
2,265,000 |
|
Non-Current Liabilities |
3,250,873 |
7,326,000 |
2,677,336 |
7,304,000 |
|
Total Liabilities |
5,707,993 |
9,426,000 |
5,400,446 |
9,569,000 |
|
Net Assets |
17,995,126 |
18,647,000 |
19,073,701 |
19,320,000 |
|
Capital |
10,949,097 |
10,949,097 |
10,949,097 |
10,949,000 |
|
General Reserve |
7,046,029 |
7,697,903 |
8,124,604 |
8,371,000 |
|
Equity |
17,995,126 |
18,647,000 |
19,073,701 |
19,320,000 |
|
Statement of Cash Flow |
||||
|
Year ended 30 June |
2015 |
2016 |
2016 |
2017 |
|
Audited ($) |
Business Plan ($) |
Audited ($) |
Business Plan ($) |
|
|
Net cash generated from operating activities |
4,072,727 |
3,422,000 |
4,324,276 |
4,714,000 |
|
Net cash used in investing activities |
(3,388,172) |
(5,995,000) |
(2,768,854) |
(7,108,000) |
|
Net cash used in financing activities |
(1,044,805) |
1,524,000 |
(1,471,959) |
1,077,000 |
|
Net increase/(decrease) in cash and cash equivalents |
(360,250) |
(1,049,000) |
83,463 |
(1,317,000) |
|
Cash and cash equivalents at the beginning of the year |
2,208,937 |
2,849,000 |
1,848,687 |
2,849,000 |
|
Cash and cash equivalents at the end of the year |
1,848,687 |
1,800,000 |
1,932,150 |
1,532,000 |
|
Financial Review |
2015 |
2016 |
2016 |
2017 |
|
Audited ($) |
Business Plan ($) |
Audited ($) |
Business Plan ($) |
|
|
ROE |
11% |
9% |
11% |
13% |
|
NPAT ($) |
1,971,017 |
1,643,000 |
2,157,149 |
2,535,000 |
|
EBIT ($) |
2,738,980 |
2,367,000 |
2,995,285 |
3,557,000 |
|
Gearing ($) |
18% |
39% |
14% |
38% |
|
Cash Flow from Operating Activities ($) |
4,072,727 |
3,422,000 |
4,324,276 |
4,714,000 |
|
Interest time cover |
24 |
13 |
25 |
20 |
|
Operational Review |
2015 |
2016 |
2016 |
2017 |
|
Audited ($) |
Business Plan ($) |
Audited ($) |
Business Plan ($) |
|
|
Gross Tonnage of called vessels |
1,698,851 |
1,877,189 |
1,937,609 |
2,035,574 |
|
Cargo throughput (tonnes) |
290,532 |
342,599 |
333,847 |
340,000 |
|
No. Containers (TEUs) |
17,621 |
19,108 |
19,914 |
21,417 |
|
Number of Ships called |
150 |
158 |
179 |
167 |
|
Number of Employees |
150 |
165 |
152 |
150 |
The Ports Authority Tonga's Annual Report will be available at the Head Office, 1st floor Ports Authority Tonga Building, Queen Salote Wharf, Maúfanga at $50 paánga per copy. It can also be downloaded from the Ports Authority Tonga's website: www.portsauthoritytonga.com
Pulusi ‘o e Fakamatala Fakata’u 2016 – Ma’u Mafai ki he Ngaahi Taulanga ‘o Tonga
3. Ngaahi Ngaue Lalahi Na’e Fakahoko
- Fokotu’u ‘o e ngaahi maama LED ‘i he Uafu Kuini Salote ‘a ia ’oku lelei age ‘a ‘ene ngaue‘aki e ivi‘i ‘uhila pea si’i hifo e volota ‘oku ne faka’aonga‘i ka e lolotonga ia ‘oku ne ‘omi ‘e ia ha maama lahi ange.
- Fakalelei’i ‘o e tau’anga ‘iote ‘i he Uafu Vuna.
- Valita ‘o e konga ‘i he Uafu Fakatu’apule’anga ko Kuini Salote.
- Langa fo’ou ‘o e Uafu Fakalotofonua.
- Fakataumai ‘o e misini hiki mo fokotu’utu’u koniteina.
- Fakalelei’i ‘o e Fale ‘Ulu’i ‘Ofisi – Konga 1.
4. Ngaahi Fatongia Fakafeitu’u mo Fakafonua
- Na’e to e ikuna’i ‘e he Ma’u Mafai ha makamaile fo’ou ‘i he ‘ene fuofua a’usia ‘a hono tanaki ‘a e pa’anga humai fakalukufua ko e $10 miliona ‘i he ngata’anga ‘o e ta’u. Ko e hiki hake ‘eni ‘aki ‘a e peseti ‘e 13% mei he ta’u kuo hili pea ma’olunga ‘aki ‘a e peseti ‘e 6% ‘i he Patiseti.
- Na’e toe fokotu’u foki ‘e he Ma‘u Mafaí mo ha lekooti fo‘ou ne te‘eki a‘usia ki mu‘a, ‘a ia ko e tupu haohaoa $2.2 miliona, hili hono to‘o ‘o e tukuhaú (NPAT), ‘o fakalaka hake ia ‘aki e peseti ‘e 16% mei he ola ‘o e 2014/15.
- Na’e hiki hake ‘aki ‘a e peseti ‘e 62% ‘a e lahi ‘o e totongi ‘inasi pe tiviteni na’e totongi ki he Ma’u ‘Inasi ki he $1.6 miliona, ‘a ia ko e peseti ia ‘e 75% ‘o e tupu haohaoa.
|
Fakahoa 'o e mo'ua 'i he no mei he pangike ki he Sino'i 'Inasi |
||||


